
It’s widely accepted that visuals like diagrams and flowcharts are the best way to simplify and communicate complex information. But what should you consider when mapping a business process? Do you know what a diagram is?
What is a process diagram?
Process diagrams allow users to map all the processes used by a company’s different departments. That’s why it’s important to understand how it works and how to put it into practice.
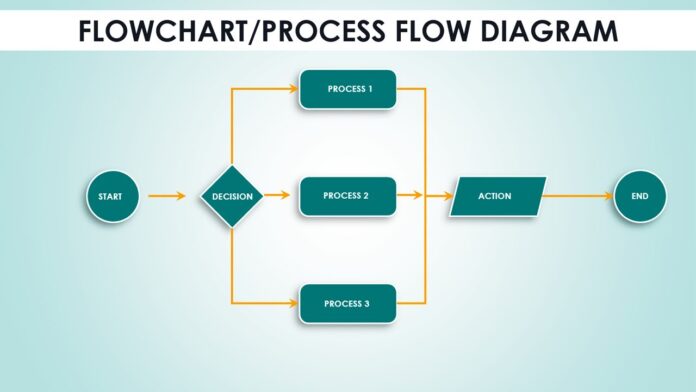
A flowchart, for example, makes processes easier for everyone to follow, simplifying and presenting workflows more clearly by breaking complex processes into smaller steps.
Professionals are able to analyze a process more efficiently by creating a diagram. A visual scheme identifying events and decision making, their beginning and end, as well as the people and teams involved, makes it possible to understand more clearly how everything should happen.
This is important because it allows you to make adjustments to problematic steps and optimize the entire process, in case performance indicators suggest that efficiency levels are not living up to expectations.
These processes can be divided into three main types:
1 – Primary processes: also known as operational processes, these generate value for the customer and are the focus of the business.
2 – Support processes: these processes support the primary processes.
3 – Management processes: these processes deal with measuring, monitoring and adjusting the activities of the operational and support processes. This type also ensures that the organization achieves its defined objectives, through tasks such as creating a project management plan, carrying out strategic planning and evaluating performance.
Optimizing these processes means analyzing them, by mapping them in a clear and detailed way. A good process diagram allows for accurate analysis and makes it possible to make adjustments more efficiently.
What are process diagrams for?
Companies are made up of people with different roles and responsibilities who work together on common processes.
Process diagrams can help to establish a shared understanding of these actions and ensure that a task is performed by a team in a uniform way over time. In addition, they promote transparency and help strengthen alignment within an organization.
Diagrams can serve as high-level guides or they can act as a step-by-step example to help an employee accomplish a specific task, while also playing a role in optimizing and communicating any internal process, especially in complex cases that change frequently over time or involve several people.
Why do I need to map business processes?
Process mapping is the act of analyzing and documenting a high-level process from the main elements or describing details of a workflow.
This action results in a process diagram – which uses visuals such as infographics and flowcharts to represent processes, breaking them down into steps, highlighting their actors, and allowing everyone involved to assimilate and memorize information.
They help teams to follow procedures and perform tasks correctly over time, promote team alignment, and establish a shared understanding of essential processes.
Tips for mapping a process diagram
1 – Collect information
Before starting any kind of diagram, you need to know exactly what you want to show, and to whom. Ask yourself what information you intend to present. Here are some examples:
- Specify those responsible and their roles for specific tasks – organizational chart;
- Inform and convey a unique message that does not require context – infographic;
- Communicate the deadline for each part of the process – timeline and charts;
- Highlight the critical points, or the inputs and outputs – flowchart;
- Provide a broad view of a new employee project – flowchart;
- Help an employee perform tasks – flowchart;
- Show changes over a set period – timeline;
- Organize and show groups or patterns – mind maps.
2 – Choose the right type of chart

Traditionally, business process diagrams take the form of flowcharts, but the type of chart should always be chosen based on the information you need to map, the purpose of the diagram, and the audience you want to communicate with.
In summary, types of business process diagrams include flowcharts, mind maps, process infographics, workflow diagrams, customer journey maps and more.
A mind map, for example, might be better for communicating the goals and tasks of a specific project. Flowcharts, on the other hand, are more flexible and frequently used, as they are easily understood by different audiences and customized to suit the level of detail required for any process.
3 – Some tips and best practices for design and formatting
- Keep it simple: use limited varieties of fonts, sizes, and shapes. This will make your diagram look professional, and facilitate data visualization;
- Use borders to increase information density;
- Colors and icons are great for emphasizing important information;
- Include labels or a caption;
- When using symbols, ask yourself if everyone will understand what they mean. Otherwise, insert captions to videos to enlighten your audience.
How to create a diagram?
1 – Define the scope: you can treat your diagram like any other new work project. Scoping can help ensure that your diagram clearly represents the structure of the team and determines its overall purpose.
2 – Collect information and decide how to build the diagram: collecting information is the most important step in creating an organizational diagram, because without the right information it will not be possible to proceed.
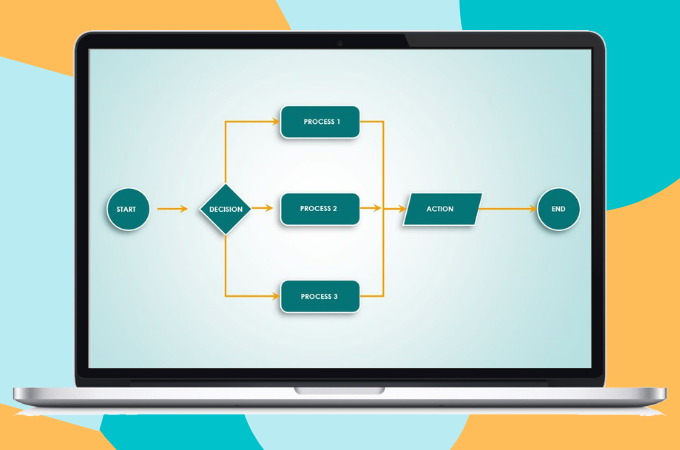
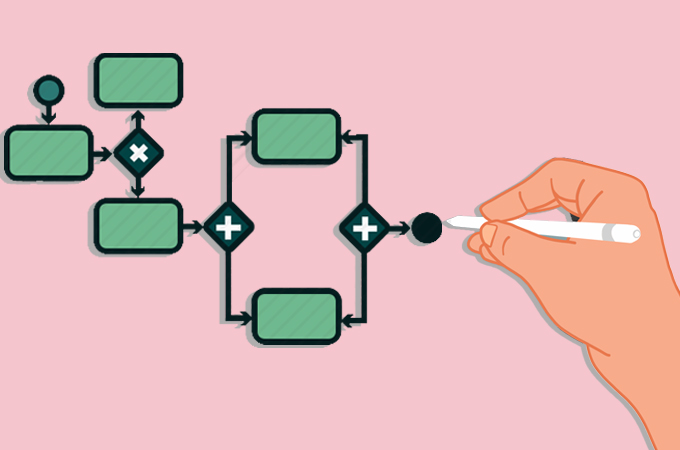
Deciding how to build the diagram is crucial, because different tools can make the process easier. Drawing the diagram by hand is not time efficient and will make sharing the results difficult, so consider leveraging the power of an online diagram tool for this process.
3 – Plan updates: having created the diagram, use a team calendar to plan regular updates. After all, company structure and team dynamics are likely to change with some frequency. Using a digital diagram makes it easy to update the structure and pass it on to other team members.
Organizations use diagrams to optimize work quality and efficiency and maintain properly standardized procedures when analyzing, communicating and correcting processes at work.
Whether they’re concerned with team alignment, customer journey efficiency or evaluation, professionals from all industries need to know what a diagram is. These tools are a practical and efficient option for optimizing processes. They benefit everyone in a simple and didactic way, improving the daily lives of professionals, managers and customers.


 Systems")


