Trading binary options can be a fantastic way to make a profit, but it can be intimidating for those who are just getting started. Given the wide variety of options available, it can be challenging to determine which techniques will be successful and which won’t.
Fortunately, traders can use advanced charting techniques to find patterns and indicators that could result in profitable trades. By utilizing these tools, traders can improve their odds of consistently making money with binary options trading. In this text, you will come across a thorough analysis of these techniques, which will give you a better understanding of the whole idea once you finish reading this text.

What are the key indicators and patterns used in advanced charting techniques for binary options trading?
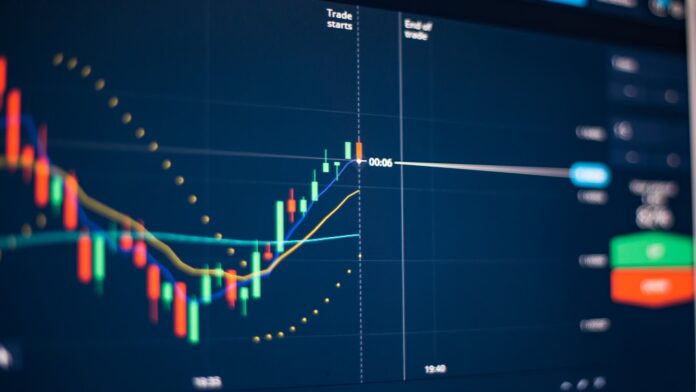
Advanced charting techniques for binary options trading involve using various indicators and patterns to identify potential trading opportunities and experienced traders use them heavily. The most commonly used indicators include moving averages, Bollinger Bands, Relative Strength Index (RSI), Stochastic Oscillator, MACD, Parabolic SAR, and Fibonacci Retracements. Moving averages are used to identify trends in price movements over a certain period. Bollinger Bands measure volatility by plotting two standard deviations away from a simple moving average.
The RSI is an oscillator that measures the strength or weakness of a security’s price movement over time. The Stochastic Oscillator determines whether a security is overbought or oversold relative to recent pricurrentels. MACD stands for Moving Average Convergence Divergence and is used to identify changes in momentum between two different moving averages. Parabolic SAR is an indicator that helps traders identify potential entry and exit points based on past price action. Finally, Fibonacci Retracements are used to predict areas where support or resistance may be found based on previous market swings (more on that in the remainder of the text).
What are the benefits of advanced charting techniques for binary options trading?
Advanced charting techniques for binary options trading can provide traders with a wealth of information to help them make more informed decisions. By using advanced charting techniques, traders can identify trends and patterns in the market that may not be visible to the naked eye. As a result, they can better anticipate price movements and make more accurate predictions about future price action.
As an additional “helper tool,” traders can set up automated alerts to notify them when specific criteria are satisfied using modern charting techniques. This enables them to stay current in their fields and promptly seize any opportunities. The ability to backtest tactics before using them in real-time trading scenarios is another benefit of advanced charting techniques that helps traders lower risk and maximize potential gains.

How to identify high-probability indicators and patterns in binary options trading
In binary options trading, a combination of technical analysis, fundamental analysis, and risk management are all necessary to spot high-probability indicators and patterns. Technical analysis is the study of an asset’s price changes over time in order to find trends and patterns that can be used to forecast future price changes. Fundamental analysis examines the underlying variables that affect an asset’s price, such as economic statistics, current affairs, and company performance.
Risk management is equally essential when trading binary options since it enables traders to limit their exposure to risk by setting up the appropriate stop losses and profit targets. As already mentioned, traders should look for reliable signals from reliable sources, such as charting tools or automated trading systems, in order to discover high-probability trades (more info on that in the next section). Note also that traders should always use solid money management techniques to ensure they are not taking on excessive risk with each transaction.

Utilizing oscillators, Fibonacci retracements & other tools for more accurate predictions in binary options trading
Binary options trading can indeed be lucrative for those who know what they are doing, but it can be difficult to predict the market accurately. To increase your chances of success, you should use oscillators, Fibonacci retracements, and other tools. Let’s examine each tool so that you get a better idea.
Oscillators are technical indicators that measure momentum and help traders identify overbought or oversold conditions in the market. They can also be used to identify potential entry points for trades. Fibonacci retracements are another useful tool for binary options traders as they allow them to identify support and resistance levels in the market. By using these levels, traders can determine when prices may reverse direction or continue their current trend. Of course, there are many other tools available such as moving averages, Bollinger Bands, and Ichimoku clouds which can all help traders make more accurate predictions when trading binary options.

Analyzing volatility with moving averages for better risk management in binary options trading
Moving averages are a great tool for analyzing volatility in binary options trading.
By plotting the average price of an asset over a certain period of time, you can get a better understanding of how volatile the asset is and how it has been performing. This information can be used to help manage risk when trading binary options. For example, if you see that the moving average is trending upwards, this could indicate that the asset is becoming more volatile and therefore may be riskier to trade.
On the other hand, the asset may become less volatile and, as a result, less dangerous to trade if you see that the moving average is drifting lower. Also, you may learn if there are any notable variations in volatility over time by examining numerous moving averages with various time frames (for example, short-term vs. long-term). This information can then be utilized to make informed decisions about which assets to trade and when to enter or quit trades in order to maximize earnings while lowering risks, in the long run.

Is there a risk management approach that must be taken into account when using advanced charting techniques for binary options trading?
Indeed, any trading plan must include risk management, but this is especially true for binary options. Setting and adhering to a maximum loss limit is crucial when employing sophisticated charting techniques for binary options trading. You should thus never invest more money than you can afford to lose.
Moreover, always make sure that you have clearly understood the risks associated with each trade before entering into it so that you clearly understand how much capital is best suited for your goals.


